Dashboard
About the Dashboard
Technology Dashboards
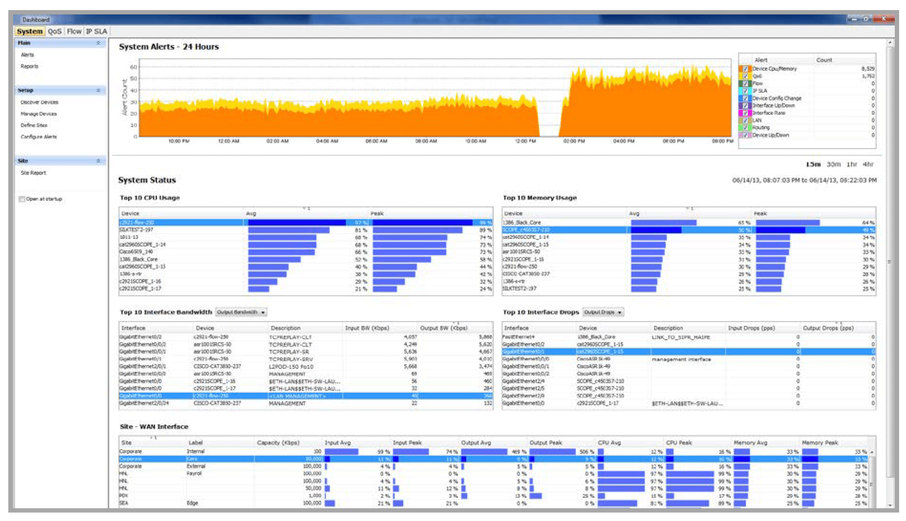
The LiveNX Dashboard provides real-time system-level alert and device status information. The Dashboard section is segmented into the flowing actionable areas, on the left Search, and subject tree, and on the right five subject tabs QoS, Flow, Routing, IP SLA, and WAN. Due to the system level, the dashboard can also be configured to open upon start-up of the LiveNX client.
Dashboards are segmented into two areas, the Menu tree on the left-hand side and the Display area. To enable automatic startup, go to the Dashboard, click on the drop-down in the top left-hand corner of the device tree view and enable Open at startup. Each Dashboard consists of a set of predefined widgets. Below is an example of the System Dashboard in the Java client.
The Action bar of the Dashboard (on the left) displays a set of actions that can be taken, each of these actions is covered in the corresponding topic Chapters:
• Alerts – Alerts and Notifications
• Reports – Reporting