Pie chart
The pie chart allows network elements for a specific KPI to be ranked, such as top circuit loads, business / leisure traffic repartition or top 10 sites for a specific application response time. You can choose and display top elements based on a specific KPI, or sort top elements based on one KPI and display another KPI (for example: application response time for my top 10 traffic sites).
Create a pie chart dashlet by clicking
 in the edition tool bar.
in the edition tool bar.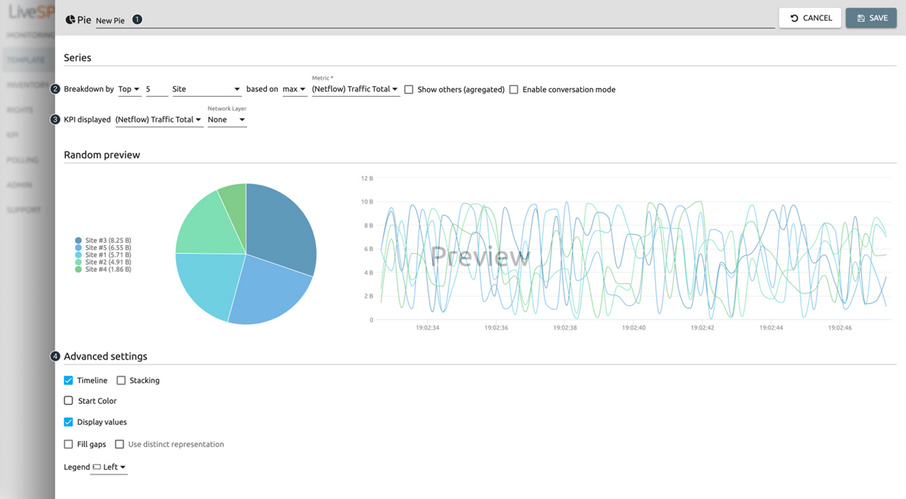
1. Name your dashlet.
2. Specify breakdown on displayed element:
a. all = KPI will be grouped and split by network element selected,
b. top = KPI will be grouped and split by network element selected for the top functionality,
c. list = KPI will be grouped and split by selected network element.
3. Select the KPI to display from the KPI library.
4. Customize your layout by adding a timeline visualization to the pie and its values if wanted.