MSI Endpoints
Media Services Interface (MSI) is used to provide better visibility and services to media applications.
To include MSI endpoints in your system topology, go to Tools > MSI endpoints.
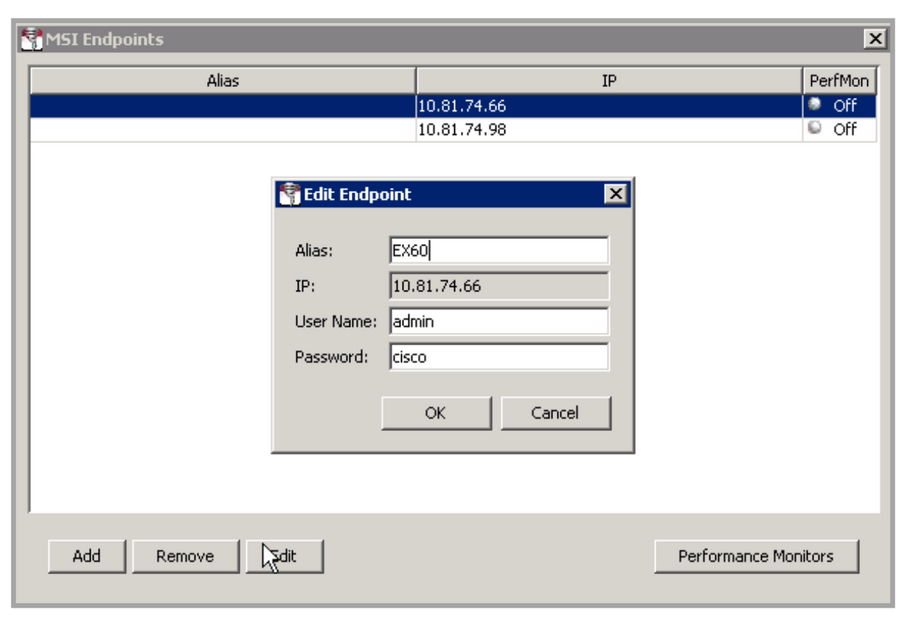
Click on Add, specify the IP addresses of your endpoints, select among User/Password, User/Password Proxy or Certificate and then complete the fields. Click on OK.

Click on the desired IP address and click on Edit to add an Alias.
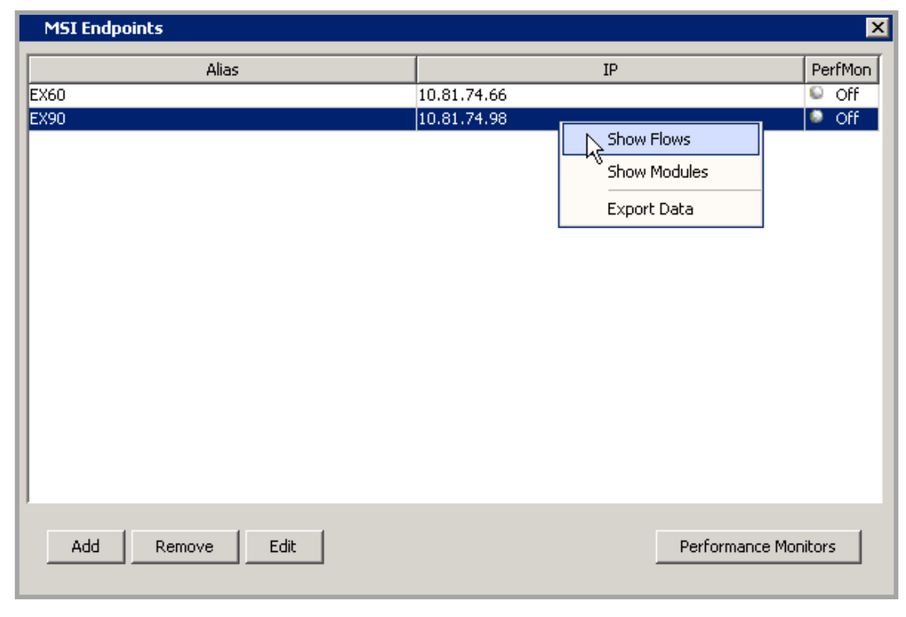
Right click on an individual endpoint to see flows, to show modules or to export data associated with that endpoint.
Return to the MSI Endpoints window, choose an MSI endpoint and then select Performance Monitors. Choose a time interval to monitor the data and then select either flow type Real-time Transport – RTP or Transmission Control Protocol – TCP.

Select a flow, right click and select Show Reports to view the Performance Monitor Report. In this example, the test was run four times at ten-second intervals.

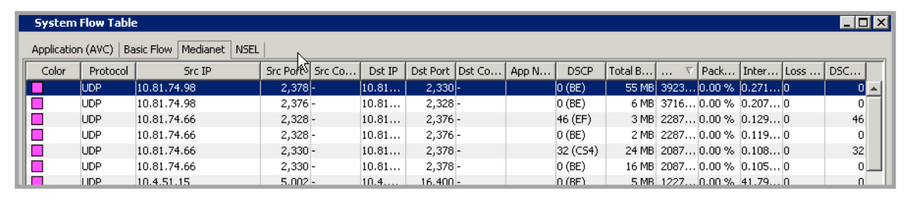
To get per hop performance data, go to the System Flow Table, click on the Medianet tab and then select the desired flow.
Right-click on the selected flow, choose Execute Mediatrace and select MSI Endpoint. Click on Execute Mediatrace.
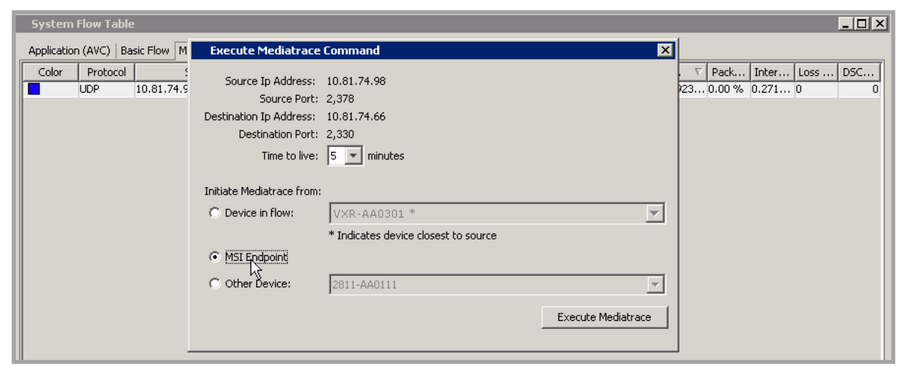
The Mediatrace report tabulates the performance data on a per-hop basis from source to destination.