SD Access Traffic Assessment
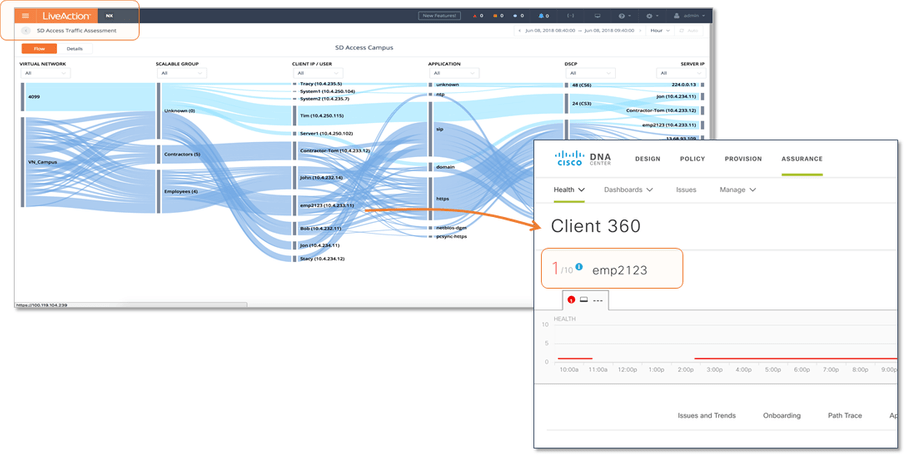
The SD Access Traffic Assessment story provides a Sankey diagram for visibility into both macro and micro level segmentation of traffic controlled by a SD-Access fabric.
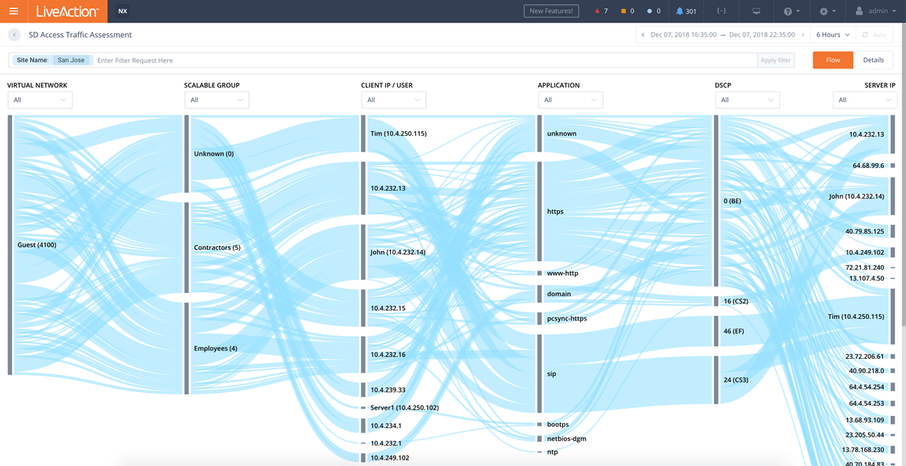
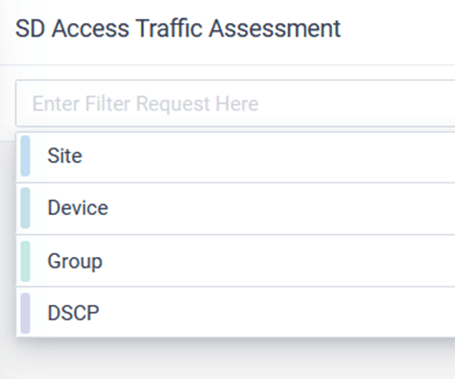
Filters can be applied to focus on the specific conversations of interest.
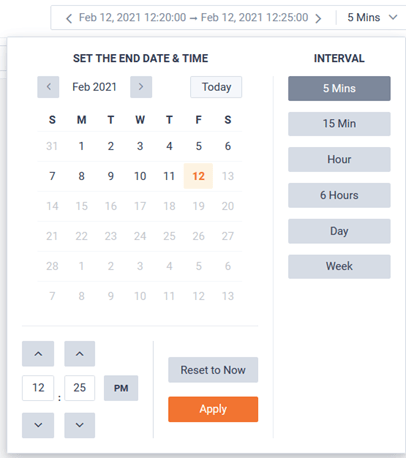
Historic time ranges can be selected for finding the Flows of interests.
The page can optionally be auto-refreshed by toggling the button in the top right of the page.